Over the last few years, several vendors of particle analysis equipment (those serving the EV community) have made incorrect blanket assertions about the limitations of NTA methods. While it is generally known that many published NTA data of EV’s start at > 100 nm for their size mode and have a log-normal decay to larger sizes, it should be emphasized that the majority of these data reports represent measurements with other vendor NTA systems. Particle Metrix wants to emphasize that if an EV size mode is < 90 nm, we can measure it!
Why is there a disparity between what other vendors claim and what is possible? In the case of ZetaView® users, the solution is to use an optimal SOP for the application, most notably the requirement for using maximum settings for camera sensitivity & gain. If you already own a ZetaView system and need some help with seeing the smaller EVs, please consult with your PMX sales contact to receive the document “ZetaView Software Parameter Definitions”, which explains all of the camera & tracking settings and also gives you starting SOPs for several sample types.
In order to verify that ZetaView systems can measure EV size modes < 75 nm, we first show several real-world analyses, obtained by routine efforts during customer installations, and where each used a standard SOP for measuring EVs. The specific identity of the first example was not divulged to Particle Metrix during installation, but regardless, we were given an exosome sample in order to establish to our new customer that we can achieve results that are superior to our competition. The pronounced size mode of 71.6 nm was sufficient proof for that customer. The next example was from processed serum, where the specific steps of sample preparation were not divulged to us, but where the new customer expected a size mode well below 100 nm. Again, that new customer was not disappointed with a resulting size mode < 65 nm. In both cases, running EV samples is part of our final phase of customer training, whereby these new customers use the same SOP for future ZetaView NTA analyses of their EVs.
In addition to showing EV analyses, the next set of data represents our rebuttal to a recent website presentation of data, which was an erroneous attempt to measure 50 nm silica using a ZetaView system. This poorly executed effort was conducted by a competing vendor, and was clearly done without using the correct SOP, thus prohibiting success.
Silica does not scatter light efficiently and is therefore considered a suitable surrogate for EVs when benchmarking particle size & concentration. In fact, Particle Metrix produced an application note based on measurements of 90 nm silica several years ago (see our website).
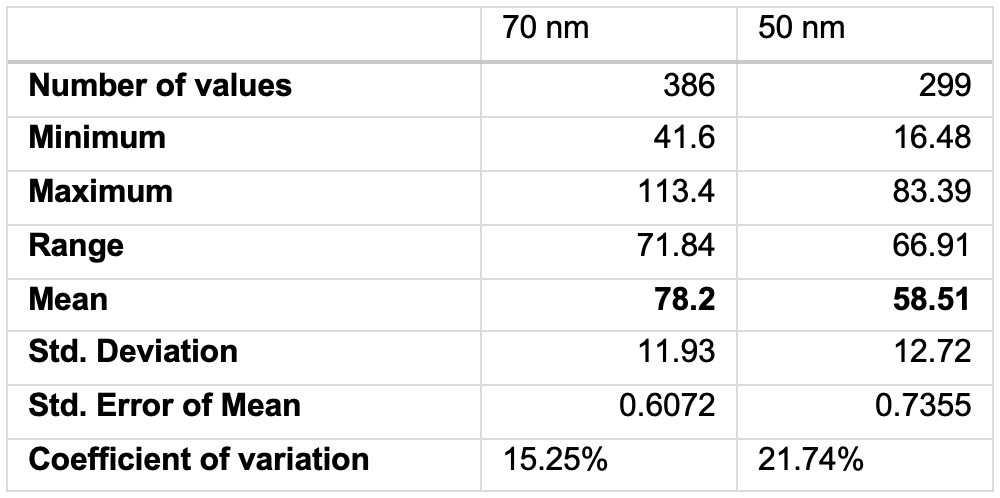
Our current results were produced from measurements of 50 nm & 70 nm sicastar® silica samples, provided by MicroMod (Germany). The nominal sizes reported for these sicastar® samples were validated by MicroMod with DLS measurement. We subsequently acquired our own orthogonal measurements, where TEM results provided by a 3rd party contract lab (Alpha NanoTech) yielded suitable confirmation of their sizes. Also shown is a micrograph of the 70 nm silica and sizing data for both samples.
Therefore, we have established here that the ZetaView NTA system is capable of measuring EV samples with size modes < 75 nm, as well as measuring silica beads with size modes of 50 & 70 nm. Furthermore, if you use the wrong SOP for any instrument, you will usually get a poor result. Here’s the good news: proper analysis with a ZetaView system provides greater versatility for your lab, including measurement of smaller particles (<100 nm), larger particles (> 200 nm, unlike SP-IRIS), and fluorescence NTA (unlike RPS).
To summarize: while much of the scientific literature reporting NTA data for EVs continues to show size distributions with modes starting > 100 nm, and that competing technologies are claiming NTA cannot measure anything smaller, we hope that the validated message from Particle Metrix is now clear: Yes We Can!
There are so many conflicting claims involved with the business of promoting scientific analytical instruments, and we sympathize with researchers who are forced to wade through the maze of contradictions. As such, we challenge those who are buying EV lab tools to give us a call and perform their due diligence rather than accept false narratives.
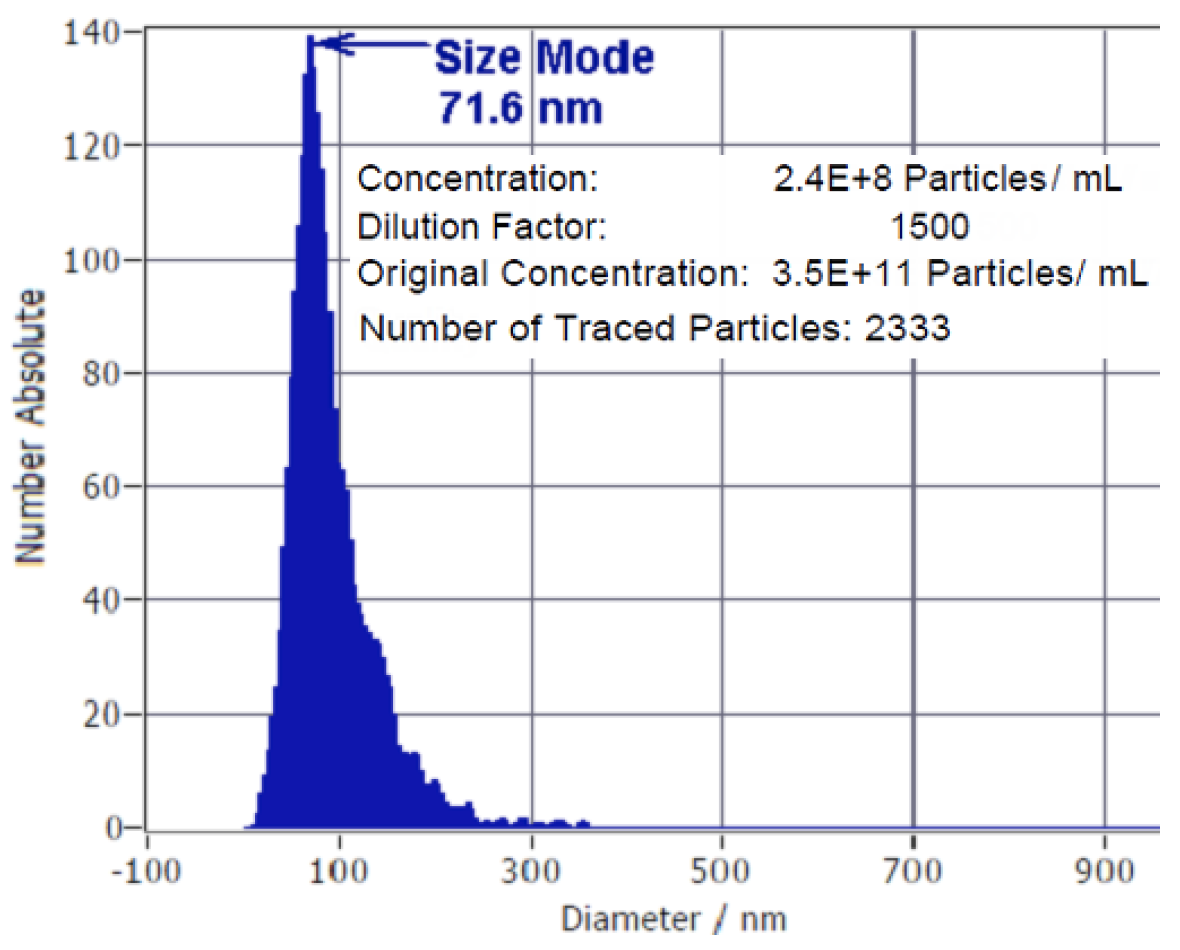
EVs with 71.6 nm mode, using ZetaView unit with 520 nm laser
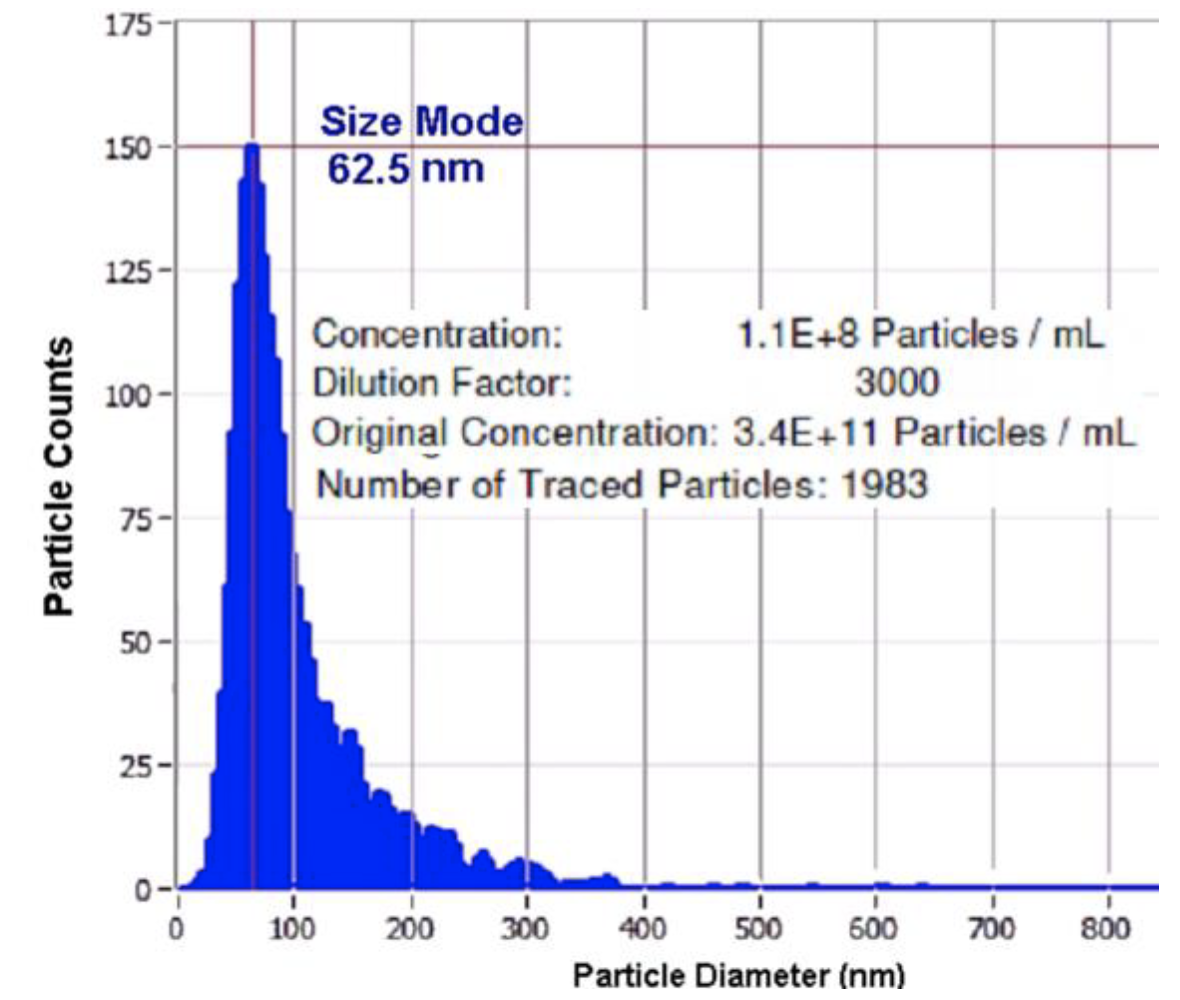
Serum-derived EVs, 62.5 nm mode, ZetaView with 488 nm laser
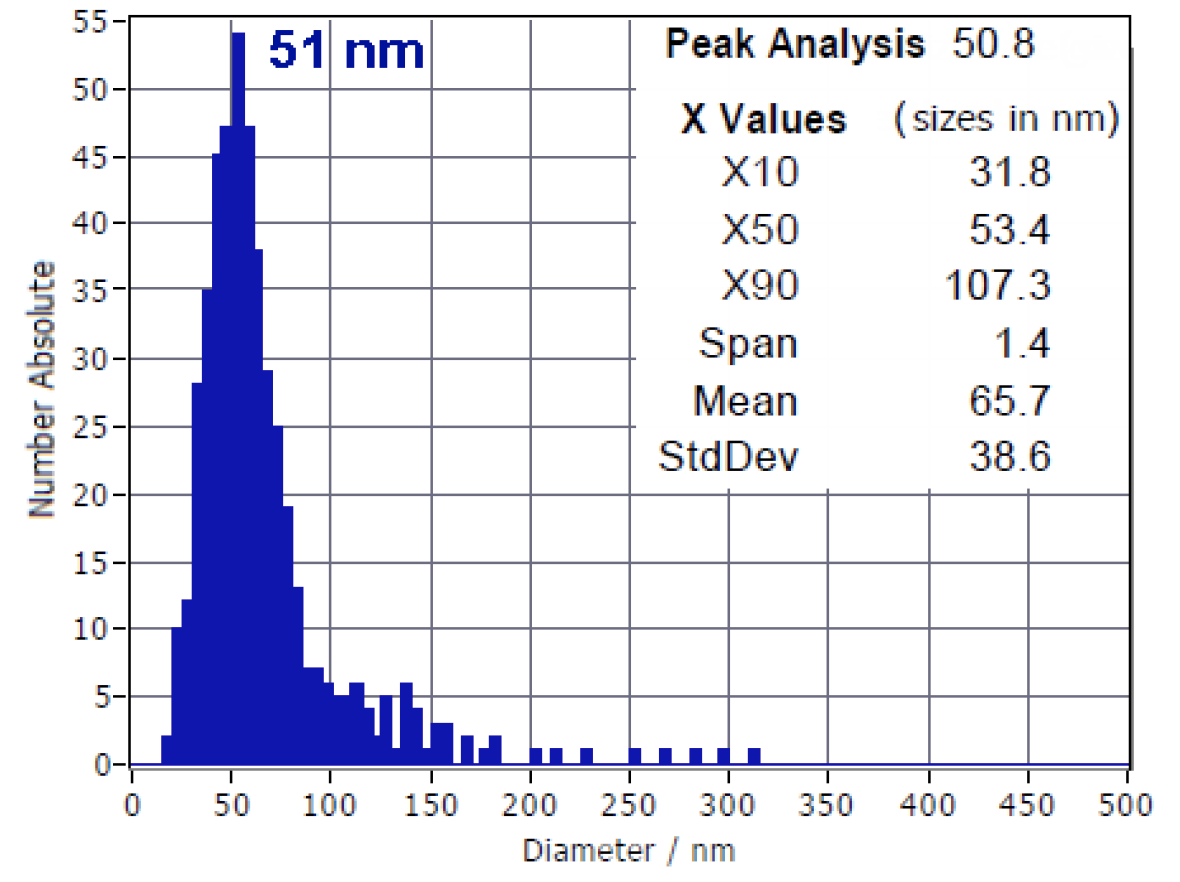
ZetaView(R) Measurement of 50 nm silica particles
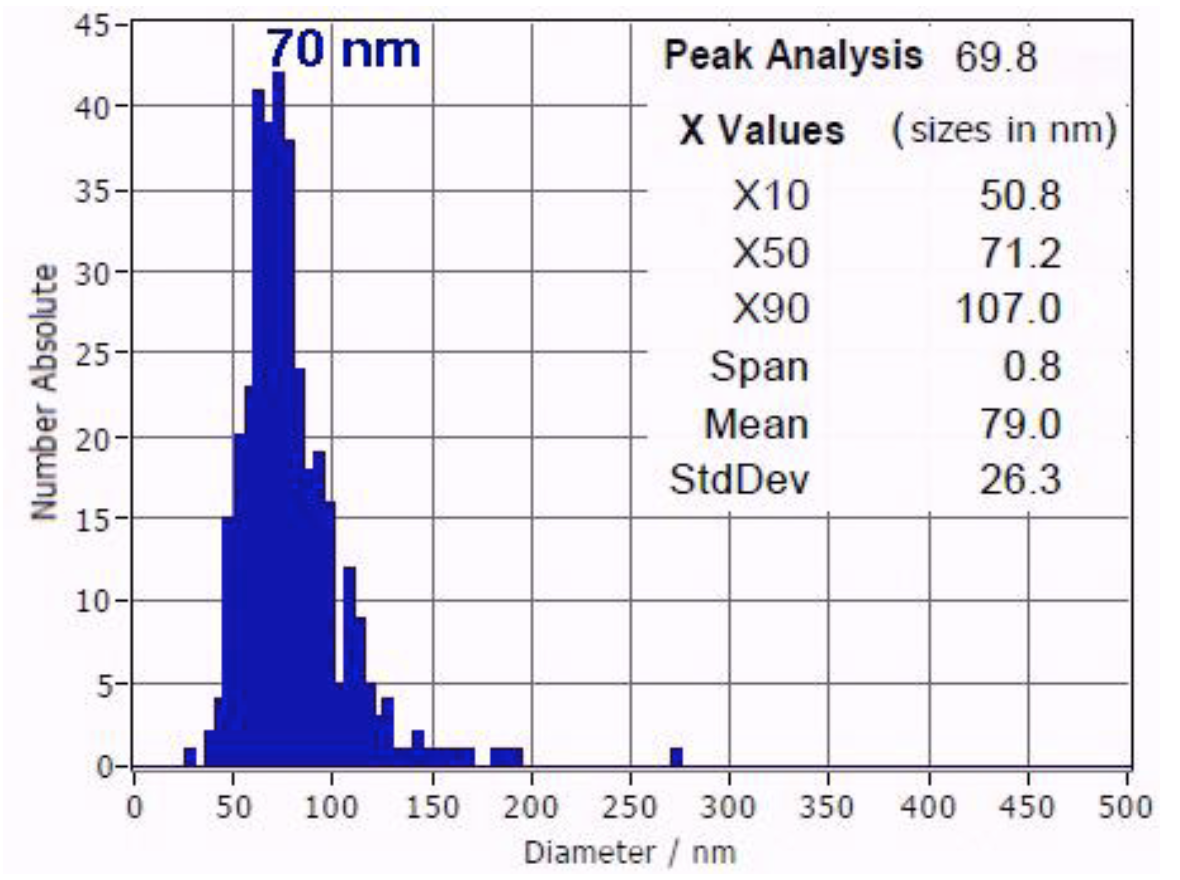
ZetaView(R) measurement of 70 nm silica particles
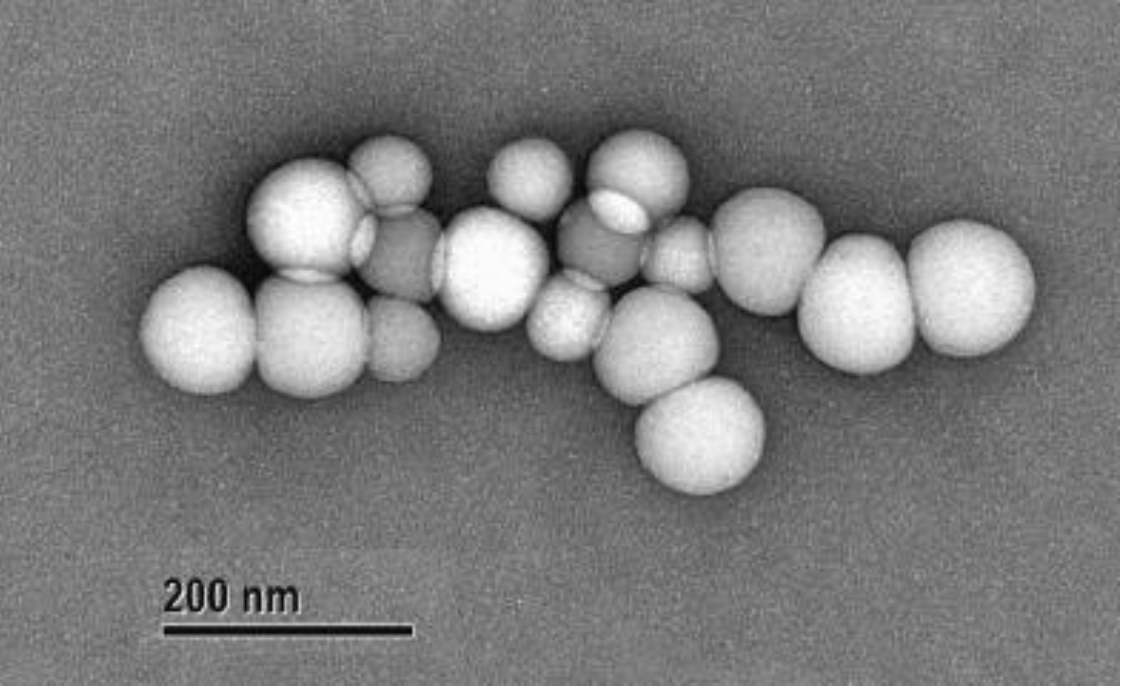
TEM microphotograph of 70 nm sicastar silica particles
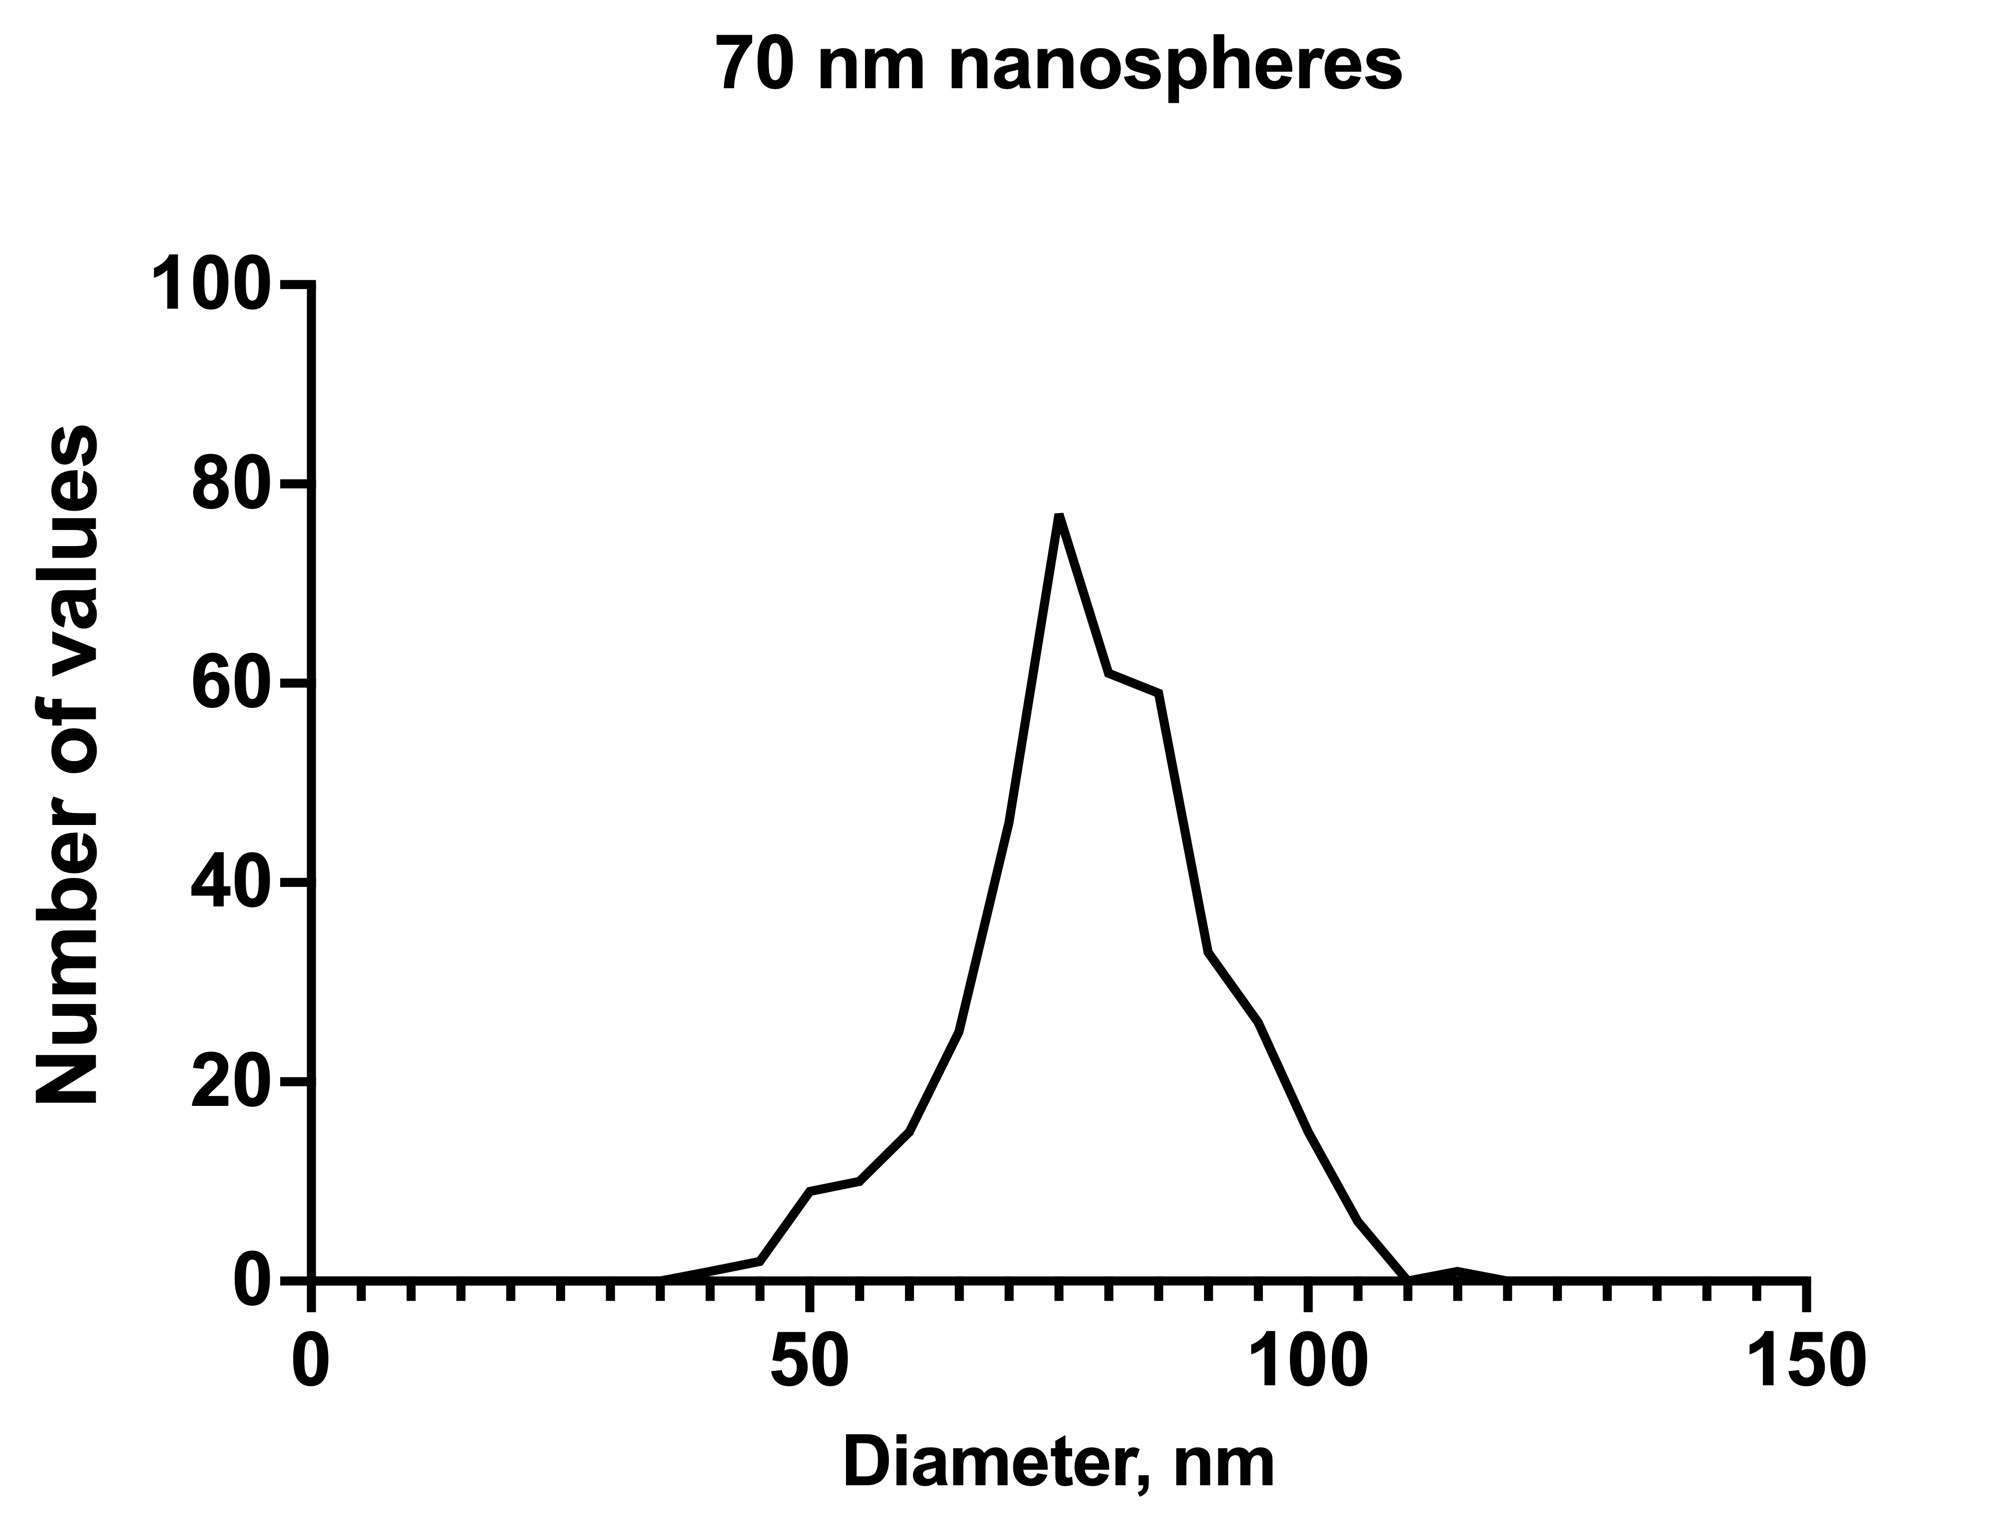
PSD of 70 nm sicastar® silica particles from TEM
Table 1. TEM image-based size distribution analysis
